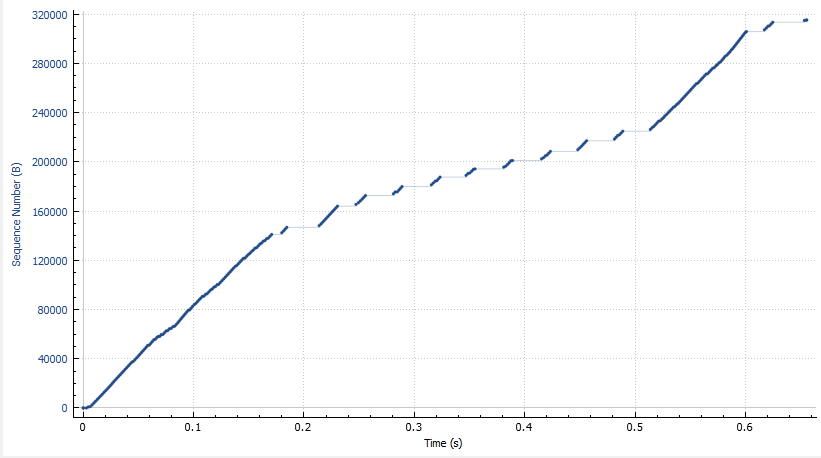
My loopback has a different metric '50' than other interfaces which have a '1'. Could this have something to do with the dfference?
On Sun, Feb 12, 2017, at 11:21 AM, samira afzal wrote:
Thanks a lot for your useful information Jaap.
I was thinking because the simulation is loopback it has to have always the same output.But today i took the result and i saw that i have different throughput and rtt. What could have effect on localhost and loopback ? My computer connection to the internet is eth0 ( and my computer has not wifi connection) . and i captured information on "loopback:lo" interface. Thanks a lot for your time
Hi,
If you would zoom in right at the origin, you’ll likely to see the slow start. but it will rapidly transition to congestion avoidance.
Thanks,
Jaap
Hi all,
I
got sequence numbers vs. time . Data transmission is over
TCP and localhost from client to server. As the transmission is on TCP, I
had the expectation that TCP starts to send 2 packets first and then 4 ,
8, 16 and etc. Something similar to
http://packetlife.net/blog/2011/jul/5/tcp-slow-start/. but my Graph is different. and i can't understand why? Is it possible to understand when
TCP slowstart phase begins and ends?
Thank you for your time and help.
___________________________________________________________________________
___________________________________________________________________________
___________________________________________________________________________
