Press "F1" while in the TCP Stream Graphs window, to see the available keystrokes that allow you to move around the graph (zooming in and out, etc).
Just be mindful that when you launch TCP Stream Graphs, you get a totally different view depending on whether you have selected a Client to Server versus a Server to Client packet first up. Generally the 2nd (for instance the selecting the SYN-ACK) will be the most useful. This will show the C-S-C round-trip-time, wherease selecting the initial SYN packet will show you the S-C-S RTT, which is generally not as useful.
If you really do have a RTT greater than 1 second it should automatically scale to that. (In my case I just tested a stream that had up to a 1.8 sec RTT and it displayed correctly.
Regards, Martin
MartinVisser99@xxxxxxxxx
On 9 January 2012 05:14, Sheahan, John
<John.Sheahan@xxxxxxxxxxxxx> wrote:
That changed worked perfectly Martin and gives me a great view of the latency for any stream. I had tried the TCP Stream Graph but I notice that I am unable to change the Y Axis value to anything higher than 1 second so I constantly miss the graph points when ever latency between packets is higher than 1 second using this method.
Do you know if there is a way to change the Y axis values on a TCP Stream Round Trip Time Graph to be more than 1 second or is this a known limitation?
johnny
Hi John,
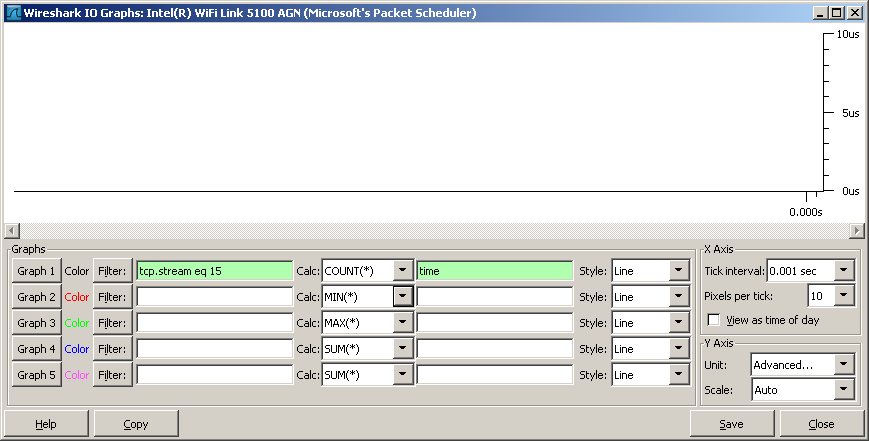
You have almost got there, but not quite. In the variable field where you have put "time" you need to put a variable that will make sense. Unfortunately "time" I think is actually a protocol, and probably not relevant. If you open up the "Frame" section of the Packet Details of a packet, you will see a number of relevant time variables. In your case I would choose "frame.time_delta_displayed". (You can find out the variable name by selecting the relevant field, and looking in the status bar.)
You can then use this in your IO graph.
Don't forget for TCP streams you can also use TCP Stream Graphs available under the Statistics menu, which can also help you identify delays.
Regards, Martin
MartinVisser99@xxxxxxxxx
On 8 January 2012 01:44, Sheahan, John <John.Sheahan@xxxxxxxxxxxxx> wrote:
I have filtered out a single conversation and I have the time display set to “Seconds since previously displayed packet”. I want to now add the time field to a graph to show how long it took between packets.
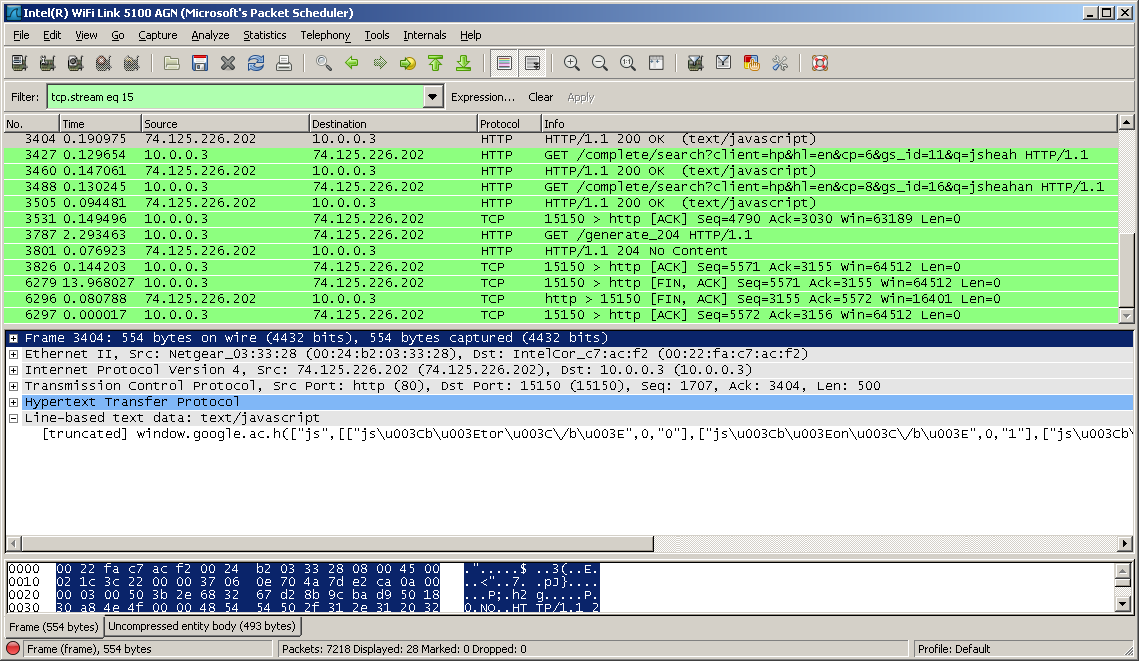
Here is a screen shot of the filtered conversation:

Here is my attempt at adding the Time field for this filtered conversation to the graph which did not work and I’m not sure what I’m doing wrong:

Thanks,
Johnny,
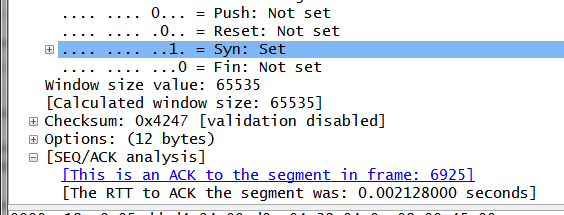
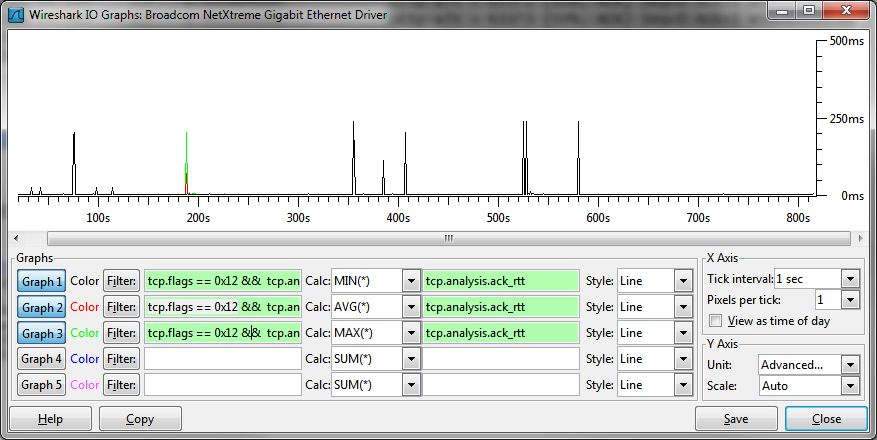
The easiest way is to examine the calculated field "tcp.analysis.ack_rtt". This appears in the details window if you have TCP Sequence Analysis on.
You have to be a little careful when using this though, as Wireshark sometimes miscalculates this in the prescence of Duplicate ACKs. The best way to use it (taking out effects of the server processing delay), is during the initial handshake. So what I do is filter for "tcp.flags == 0x12" (which is the SYN/ACK) and plot tcp.analysis.ack_rtt or add it as a column.
___________________________________________________________________________
Sent via: Wireshark-users mailing list <wireshark-users@xxxxxxxxxxxxx>
Archives: http://www.wireshark.org/lists/wireshark-users
Unsubscribe: https://wireshark.org/mailman/options/wireshark-users
mailto:wireshark-users-request@xxxxxxxxxxxxx?subject=unsubscribe


