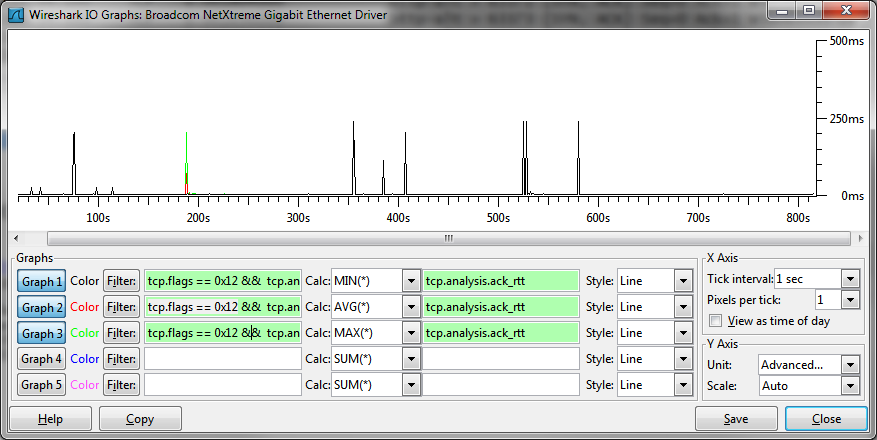
You don't have to just plot the SYN/ACK packets - you can do that for any packet that has an ACK. The only problem with using other packets is that you might have latency due to server related issues, such as request processing, as well the TCP timers. It all comes down whether you are interested in network delay (which I usually am) versus server delay (which doesn't concern me as often).
Regards, Martin
MartinVisser99@xxxxxxxxx
On 5 January 2012 12:19, Sheahan, John
<John.Sheahan@xxxxxxxxxxxxx> wrote:
Thanks Martin, I have never done any graphing at all and didn’t know about the ack_rtt.
In this case, It seems that the ack_rtt shows the rtt between the SYN and the next packet, I need to know if there were any packets in the conversation (from SYN to FIN) that have a high RTT…..is there a way to do that?
johnny
Johnny,
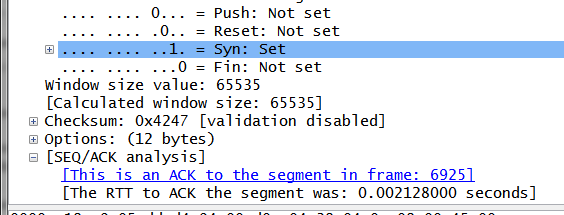
The easiest way is to examine the calculated field "tcp.analysis.ack_rtt". This appears in the details window if you have TCP Sequence Analysis on.
You have to be a little careful when using this though, as Wireshark sometimes miscalculates this in the prescence of Duplicate ACKs. The best way to use it (taking out effects of the server processing delay), is during the initial handshake. So what I do is filter for "tcp.flags == 0x12" (which is the SYN/ACK) and plot tcp.analysis.ack_rtt or add it as a column.
___________________________________________________________________________
Sent via: Wireshark-users mailing list <wireshark-users@xxxxxxxxxxxxx>
Archives: http://www.wireshark.org/lists/wireshark-users
Unsubscribe: https://wireshark.org/mailman/options/wireshark-users
mailto:wireshark-users-request@xxxxxxxxxxxxx?subject=unsubscribe

