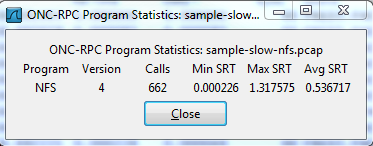
Is there a way to graph RPC Service Response Time?

I'd like to find where that 1.317575 second response time occurs in
the trace ... and I figured that a graph on which the y-axis
measured SRT and the x-axis measured time might do this for me.
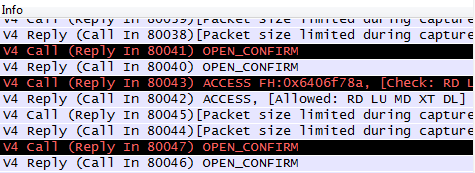
I can filter by 'nfs.opcode' and see where Replies follow Calls
tightly:

and later I can see where a number of frames intervene between Calls
and Replies (but these are Reads, so of course other frames
intervene):

But none of that helps me find that 1.3s Call/Reply combination.
Suggestions?
--sk
Stuart Kendrick
FHCRC
|


